


In this experiment, a solid turns into a liquid and then the liquid turns into a solid. The energy changes are examined
The students will take the temperature of stearic acid at regular intervals as they heat and cool it. They can observe the melting and freezing points of the acid and can plot a graph. This experiment could also be done using data-logging equipment
This practical takes quite a long time to carry out. Students can begin by simply recording their data but, once they get the hang of what they are doing, most should be able to plot the graph at the same time as taking readings. If data-loggers are being used then students will need another activity to be doing alongside the experiment.
Equipment
Apparatus
- Eye protection
- Beaker (250 cm3)
- Boiling tube (note 1)
- Thermometer (0–100˚C)
- Stop clock
- Clamp, stand and boss
- Bunsen burner
- Tripod
- Gauze
- Heat resistant mat
Apparatus notes
- If, after the practical, the boiling tubes are left containing both the stearic acid and the thermometer, immerse all the boiling tubes in hot water to remove the thermometers. The stearic acid can then be stored in the boiling tubes and recycled several times.
Chemicals
- Stearic acid (octadecanoic acid)
Health, safety and technical notes
- Read our standard health and safety guidance
- Wear eye protection.
- Stearic acid (octadecanoic acid), CH3(CH2)16COOH(s) – see CLEAPSS Hazcard HC038b. The stearic acid in this practical can be used again and again. Have enough to quarter fill a boiling tube for each student
Procedure
- Put about 150 cm3 water into the beaker.
- Heat it on a tripod and gauze until the water just starts to boil.
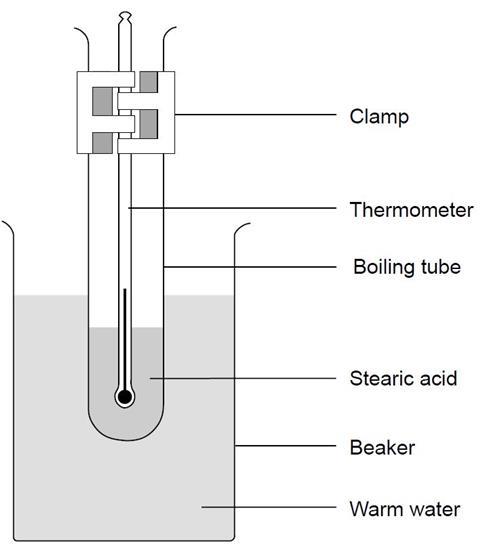
- Set up the apparatus as shown in the diagram and start the timer. Keep the water boiling, but not boiling vigorously.
- Using a suitable results table, record the temperature of the stearic acid every minute until it reaches about 70˚C. Note on your results table the point at which you see the solid start to melt.
- Use the clamp stand to lift the tube from the hot water. Record the temperature every minute as the stearic acid cools down until it reaches about 50˚C. Note on your results table the temperature at which you see the stearic acid begin to solidify.
Teaching notes
Remind students not to attempt to move the thermometer in the solid stearic acid, as it will break.
Energy must be supplied to melt a solid; this same energy is released when the liquid re-solidifies.
This presents a good opportunity to demonstrate how to maintain a steady temperature using a Bunsen burner. This can be achieved by sliding the Bunsen burner aside as the boiling becomes too vigorous; slide it back as the water stops boiling. It is not essential that the water bath is boiling. Students could be provided with another thermometer, and asked to maintain a lower temperature, say 80 °C.
A temperature sensor attached to a computer can be used in place of a thermometer. It can plot the temperature change on a graph and show this as it occurs. A slight modification of the experiment can yield an intriguing result: When the test tube is cooling place it in an insulated cup containing a few cm3 of water. Use a second temperature sensor to monitor the temperature of the water. The water temperature should rise as the stearic acid cools and it should continue to rise even as it changes state.
A slight alternative to this experiment is to plot only the cooling curve. Place all the boiling tubes with stearic acid into a large beaker. Place some hot water in the beaker and continue to heat with a Bunsen burner. Remove from the heat when all the stearic acid has melted. Students can place a thermometer into the stearic acid and place the boiling tube into a test tube rack or beaker. They take the temperature every 30 seconds or every minute and plot a graph. Many students will anticipate that the stearic acid will continue to cool to zero – it is useful to discuss why the stearic acid stops cooling when it reaches room temperature.
In either version of the experiment it is good practice for students to draw a graph of their results. There should be a clear horizontal line in the graph which corresponds to the change of state, however many school samples of stearic acid are not very pure and hence the line is often not perfectly horizontal. The exact melting and freezing points of the stearic acid may not be exactly the same and will depend on the purity of the product and where it was purchased from, but are usually around 55–70 ˚C.
Additional information
This is a resource from the Practical Chemistry project, developed by the Nuffield Foundation and the Royal Society of Chemistry.
Practical Chemistry activities accompany Practical Physics and Practical Biology.
© Nuffield Foundation and the Royal Society of Chemistry


No comments yet